BY DR. BAYNE FRENCH M.D. D.C.
In the words of my one true idol, John Denver, “let us begin.” Begin to get under the fatty hood of a fatty liver. Begin to understand why this condition is an epidemic, increasing in prevalence, and associated with inflammation, scarring, cirrhosis, and liver cancer. And begin to understand why many “healthy” readers of this article are yourselves afflicted. Yah, those “borderline” liver tests your medical provider glossed over are not good. Sorry.
Understanding terminology on the front end will help with comprehension:
Metabolism
Dr. Vanderkooi in Your Inner Engine: An Introductory Course on Human Metabolism defines cellular metabolism as “the process by which the products of digestion are chemically modified to yield usable energy.” You eat stuff, it gets broken down in the digestive tract, and those tiny food bits get absorbed across the intestinal lining into the blood stream, and then “metabolized.” Many diseases including cardiovascular, type 2 diabetes (T2D) and cancers occur when normal metabolism is disrupted.
Metabolic Syndrome
This is a grouping of five disorders that increase the risk of heart disease, diabetes, stroke, and other conditions. It includes high blood sugar, high triglycerides, low HDL (good cholesterol), increased abdominal circumference, and high blood sugar. Three or more of the five make the diagnosis. Formation of this pervasive American disease is rooted largely in how we eat.
NAFLD—Nonalcoholic Fatty Liver Disease
This is the umbrella term for excessive amounts of adipose (fat) tissue being deposited within the liver and encompasses a few variants of differing severity. Many authorities today consider this the liver manifestation of the Metabolic Syndrome.
NAFL
This is the mildest form of NAFLD where liver fat is present in the liver without inflammation or scar formation. It’s the earliest stages. Advancement in the disease cannot be predicted and is related to numerous factors like age, gender, genetics, alcohol consumption, presence or absence of type 2 diabetes, amount of sugar one regularly consumes, and whether or not that high sugar is coupled with high fat eating.
NASH
This is a worse form of NAFLD characterized by widespread liver inflammation, liver cell death, and fibrosis (scarring). Currently the only way to diagnosis NASH is with a liver biopsy. This is an intermediate stage in regards to severity and can advance to cirrhosis, liver cancer, liver failure, and the need for liver transplant. All of which represent advanced liver disease. NASH now represents the second-leading cause of liver transplants in the United States and if the trends remain, it will be the leading cause by 2025.
An association with liver disease and type 2 diabetes and gout has been known for over 120 years. In fact type 2 diabetes is the strongest predictor for NASH and cirrhosis. Just in the last few decades, however, has the recognition been made that people with prediabetes and obesity can also readily develop all NAFLD subtypes. But the condition is far more sinister, being relevant across a wide age spectrum. NAFLD is now the most common chronic liver disease in children and adolescents. Why? Because their cheap, subsidized, convenient, and delicious diet sucks.
Having practiced medicine long enough to remember a time where liver enzyme elevations on blood testing were blown off, I’ve found it fascinating the advancement in understanding about what’s actually going on at a cellular level and how diet not only contributes to liver fat accumulation but is the PRIMARY driver. And what dietary factors are to blame? NAFLD and its caldron of morbidity and mortality are inextricably linked with the consumption of sugar. The well-deserved sugar bashing will not end so buckle in or read something else.
Simple Carbohydrate Refresher
Sugar can broadly refer to simple carbohydrate, meaning monosaccharides (single carb molecules), or disaccharides (two linked carb molecules). Sugar also can refer to a specific disaccharide called sucrose that is 50:50 glucose and fructose. Glucose is a monosaccharide, makes up 50% of table sugar sucrose, and comprises the vast majority of our blood sugar. It is metabolized by every cell in the human body. Fructose is a monosaccharide and makes up the other half of table sugar. It is metabolized only by the liver. High-Fructose Corn Syrup (HFCS) is not a natural sugar. Like sucrose it is a combination of fructose and glucose, but fructose predominating, ranging from 55/45 to 65/35.
Studies
Researchers in Austria and Switzerland studied 94 healthy males aged 18-30. They were lean with a body mass index (BMI) under 24. This 2015 study was published in the Journal of Hepatology. The men were randomized to drinking 80 grams of three different types of sugary crap per day, and a control group that did not drink sugary crap. Their overall calorie consumption per day during the study did not differ significantly from their baseline caloric intake. Those men that drank fructose had fat production twice as high as those that drank only glucose and the control group. And the “make fat button” was still pressed 12 hours after drinking. Another finding was that the group that drank sucrose (remember, a 50/50 combination of glucose and fructose) had fat production a little bit higher that the fructose guzzlers.
Dr. Kenneth Cusi MD is a professor of medicine and chief of the Division of Endocrinology, Diabetes and Metabolism at the University of Florida. He gets NAFLD. He urges that medical providers more actively screen for the spectrum of fatty liver disorders and stresses treatment and prevention through optimal blood sugar management, proper diet and weight loss. According to his research, 70% of patients with type 2 diabetes have some form of NAFLD, with 50% being NASH. A full third of patients having advanced liver fibrosis.
Duke researchers this year determined that controlling blood sugar over time decreased the risk of liver scarring and fatty liver disease progression significantly. The lead author Dr. Alexopoulos, whose findings were published in Hepatology, followed the hemoglobin A1c levels of over 700 patients. The “A1c” measures sugar’s ability to chemically bind to tissues called glycation. The higher the blood sugar, the higher the glycation, and more irreversible, gumming up of your cellular machinery. The A1c result gives us a three-month blood sugar average. In this study for every 1-point increase in the A1c, the risk of severe liver scarring from NAFLD rose by 15%. This study, like many before it, underscores how critically important it is to have consistently good blood sugar, or in the setting of T2D, strive for excellent control. There is no better way to do this than to greatly minimize carb, especially sugar.
If you’ve been unfortunate enough to read my past articles you may recall that I think dietary fat is overall quite good for you. How on earth then did Dr. Scher et al. in 2020 surmise that a high fat diet actually contributed more to fatty liver than did a high sugar diet? The study was published in Diabetes Care but briefly 16 overweight males ate either a high saturated fat diet or a high sugar diet for four weeks. Then after a several week “washout” period, they would switch diets. The conclusion was that the high fat diet caused more liver fat. But there were major flaws with this study. The fat eaters ate 400 more calories than their baseline and 300 more calories than their sugar eating counterparts. Excess total calories DO make a metabolic difference. In addition, Dr. Scher did not put the study subjects on a high fat, low carb diet. Instead they ate high fat, high carb, and high overall calorie diet. In the real world I see thousands of patients that eat high fat, low carb diets and 0.00% of them have liver inflammation from fat deposition. This study offers conclusions to me far different than originally intended…high fat and high carb is an extremely unhealthy way to eat. The author himself even said “we can likely conclude that the problem is not the saturated fat itself, but rather the complete diet.”
High amounts of carb per day as recommended by our government and other authorities is the obesity and diabetic diet of America. Throw high fat into that scenario and you have what the Functional Medicine guru Dr. Mark Hyman has cautioned against for years now. And unfortunately “sweet fat” like donuts and ice cream appear to be the worst for metabolic health.
Diagnostic Considerations
Numerous guidelines exist, most of which make decent sense. Dr. Cusi recommends to first look at the liver enzymes. Every adult patient reading this article has had these done, as they are part of a Comprehensive Metabolic Panel. ALT is one liver enzyme commonly tested. If it is <20 there is a VERY low chance of fatty liver. ALT >40, especially in the setting of obesity and type 2 diabetes makes NAFLD very likely. Another liver test is AST. If >26-30 the risk of fibrosis (NASH) is relatively high. Unfortunately there is no good noninvasive way to diagnose NASH. A liver biopsy is the gold standard but most individuals who possess a liver, even a sick one, are reluctant to have a large needle make its acquaintance. Individual and combinations of blood chemical testing are being hotly pursued however, as it is just not feasible to biopsy tens of millions of affected people.
With persistent liver enzyme elevations not explained by alcohol, I will then embark on an extensive laboratory investigation to rule out hepatitis B, hepatitis C, autoimmune hepatitis, Wilson’s Disease, Hemochromatosis, and numerous other disease processes.
The next step commonly involves an ultrasound. “Increased echogenicity” is usually reported when liver fat is present. A more sensitive and specific ultrasound test is called a FibroScan. It checks for liver elasticity. With persistent liver enzyme elevation and abnormal ultrasound/FibroScan testing a liver specialist (hepatologist) is usually consulted, and liver biopsy considered.
Treatment
There is no FDA approved medication for NAFLD. Pioglitazone (Actos) is an old type 2 diabetes medication that commonly causes weight gain at target dosages (30-45mg/day). Because of this I have been reluctant to use it. Recently, low dose pioglitazone (15mg) has been studied and shows promise, with less weight gain, for blood sugar and other diabetic metabolic perturbations. And maybe NAFLD variants.
Metformin and class of injectable medications called the GLP-1 agonists, both of which I LOVE, and use all the time for the treatment of type 2 diabetes and obesity, also show promise for NAFLD.
I led off with medications just to get them out of the way. There is no substitute for marked dietary change, with resultant weight loss. Losing 7-10% of total body weight (Example: 200 pound person loses 15 pounds. 15 divided by 200 x 100 equals 7.5%) pretty much always results in significant laboratory improvements, but also reduced or resolution of inflammation on biopsy, and even reversal of fibrosis.
So what does “marked dietary change” mean?
1) Dramatic reduction of sugar. Extincting it, divorcing yourself from it, reserving it for truly special occasions like Thanksgiving, or Brian Frank’s birthday. Australian film-maker Damon Gameau ate a high sugar diet for 60 days, chronicling the experience in “That Sugar Film,” and developed evidence of a fatty liver in only 18 days. What is particularly troubling is that he didn’t eat candy, ice cream, or soda. But rather “normal” foods, like barbecue sauce, low fat yogurt, and cereal.
2) The next step is all sources of carb. The healthiest, leanest patients I see, with pristine livers, have learned how to demote starch from stapledom to garnish status.
Exercise in no way gives a green light to eating and drinking in an unhealthy manner. As discussed later, many endurance athletes look on paper very similarly to patients with type 2 diabetes and obesity.
Biochemical Geek-Out
The Journal of Hepatology published an excellent article in May 2018 reviewing the experimental and clinical evidence of how simple sugar precipitates the accumulation of fat in the liver. There were a lot of big words so it must have been written by smart people.
Both fructose and glucose are metabolized in a multi-step, similar manner. The big differences reside in the first two steps. And in those steps lies the precipitating factors responsible for fructose’s cascade of events leading to fatty liver mayhem:
1. Increased lipogenesis. This is the chemical process of fat formation. Both fructose and uric acid generated from fructose metabolism (see #5 below) cause changes in enzymes resulting in the fat formation gas pedal being stomped on. Interestingly very little ingested fructose is actually incorporated into fat directly. Numerous studies which examine fructose have shown this. It instead stimulates fat formation.
2. Impaired beta-oxidation. This is the blocking of fat burning. The same processes that turn on fat formation directly inhibit fat burning. Makes sense, right? The metabolic dial cannot point to fat formation and fat burning at the same time. The sustainably effective management of obesity (and type 2 diabetes, NAFLD, and other metabolic diseases) hinges on the ability to slowly change where that dial points.
3. Endogenously generated fructose. This is fructose that is not ingested but produced in the body. Elevated blood sugar (glucose, from type 2 diabetes, prediabetes, and a high sugar/carb meal) is converted in the liver to sorbitol, then further metabolized to fructose. Think this through…most people with diabetes contracted the disease by overconsuming sucrose and high-fructose corn syrup. Given the diagnosis, 70% will have some form of NAFLD. And given the elevated glucose in their blood, even MORE fructose is produced, driving disease progression to NASH, cirrhosis, liver failure and liver cancer. The cycle must be broken by any and every means possible.
4. Reduction in resting metabolic rate. Cox et al. in 2012 published a study in the European Journal of Clinical Nutrition showing how fructose consumption reduced fat burning and slowed the resting metabolic rate. This combination is very favorable if developing obesity is on your life list.
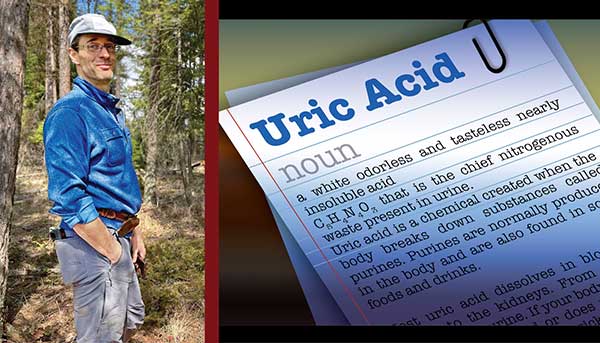
5. Uric acid formation. Fructose is the only carbohydrate that generates the formation of uric acid during metabolism. The unfortunate souls among you who have experienced the searing pain of gout know what this chemical is capable of. Aside from agonizing joint pain, uric acid directly contributes to fat formation in the liver. Uric acid has several pro-inflammatory effects. A large meta-analysis published in 2015 showed that for every 1 increase in uric acid, the incidence of NAFLD increases by 3%. Interestingly, the gout medicine allopurinol has been shown to reduce NAFLD, liver cell death, liver inflammation and scarring, and blood fat levels (triglyceride).
6. Gut permeability. After fructose from sugar or high-fructose corn syrup is unfortunately eaten and makes its way to the small intestine, it is then absorbed into the wall of the intestine. There it is acted on by fructokinase C, the same enzyme that performs the first step of fructose metabolism in the liver. Although we are equipped to handle a small amount of fructose in this manner, from fruit and figs we fought baboons for, we are NOT designed to handle large and continuous fructose loads. Direct damage to the intestinal lining results thus increasing gut permeability. Bacterial toxin called endotoxin can then enter circulation, heads directly to the liver, and over time triggers and amplifies NAFLD. In addition, fructose within the intestine alters our gut microbiome, possibly further leading to disease. For you doctors reading this, does “leaky gut” sound familiar? We all roll our eyes when patients mention this one. Well, here is one physiological mechanism. Get over it.
7. Immune system activation. Endotoxin entering our blood stream really pisses off our immune system. Our T-cells and Natural Killer cells go on a rampage, triggering inflammation and thus driving the progression from NAFL to NASH and cirrhosis.
8. Enhanced fructose absorption from the gut. It is true that the more we do of something the better we get at it, except for me and golf. The more fructose and sugar we eat, the better and more efficiently we absorb it from the intestine and into the blood stream. With repeated exposure to sugar, the fructose “transporter” Glut5 becomes more plentiful, resulting in more fructose hitting the liver. Ah our precious, stupid little bodies.
What about fruit?
While it is true that fruit contains fructose, they are much less likely to induce unfavorable metabolic changes due largely to lower fructose content per fruit unit/serving. The presence of soluble and insoluble fiber are satiating, thus limiting consumption. And that fiber can act to slow the fructose exiting the stomach, and thus it’s absorption into the blood stream. Furthermore fruit contains an array of incredible chemicals (antioxidants, flavonols, epicatechin, ascorbate, and other phytonutrients) that combat the effects of fructose.
What does the food industry think of all this?
Who really cares? I don’t. Since you asked, studies funded by the food industry shockingly fail to show a relationship between sugar intake and metabolic disease. Schillinger et al. in Annals of Internal Medicine 2016 and Bes-Rastrollo et al. in PloS medicine in 2013 explain this befuddling phenomenon.
FGISEAS (Foggy Seas)
This is the Foie Gras In Sugar Eating Athletes Syndrome. Since I’ve identified it 1000 times more than there is mention of it in the literature, I’ve decided to make up my own name for it.
The process of force-feeding livestock condensed sugar dates back to ancient Rome. That certainly takes animal husbandry to a new level, lucky critters. Their livers then became quite tasty. Foie Gras in human animals has become an epidemic, but surely athletes are different right?
Let’s look at some high-level rugby athletes. I know next to nothing about rugby, having grown up playing it a total of zero minutes. I’ve been beaten up by a few rugby players in college, however. It’s okay though, one of them is missing half of their ear. Nirengi et al. in 2018 published an observational study in Frontiers in Endocrinology looking at the differing rates of NAFLD in elite rugby players of different positions. 69 university rugby players were recruited consisting of 37 forwards and 32 backs. They trained 6 days a week, for 3 hours per day, lightweights. 29 control subjects were also recruited who did not play rugby, in fact did not engage in any regular exercise. They all drank low levels of alcohol. Forwards are just brutes. They regularly engage in tackle, ruck, mall, scrum, and other cute words. Backs perform much more sprints and endurance training. Rucking and malling must be brutal because comparatively the forwards were found to exert more energy in the form of exercise.
So who had fatty livers? 18.9% of forwards and 8.6% of backs had NAFLD. And the Average Joe control subject? 0.0% had sick livers. WHAT? One in five high-level rugby forwards had liver disease, even though they performed the most exercise? Indeed. They also had much higher fat in their blood (triglycerides), worse cholesterol profile, worse liver disease, higher BMI, and higher total fat mass. The authors stated “…we had anticipated that the physical exercise regime of the players enrolled in our study would have been sufficient to offer protection against NAFLD.” Hey, people make mistakes. I made one in the early 90s.
Exercise is generally identified as a useful strategy, totally under the control of the individual, to reduce the risk of NAFLD, cause reversal of NAFLD, and basically reduce the risk of numerous metabolic diseases. The rugby players had their exercise dialed in. The control group did not, yet possessed no evidence of liver disease. Let’s look a little deeper, perhaps at, oh I don’t know, food maybe? The forwards ate almost 5,000 calories per day and the backs almost 4,000 calories per day. The control group ate almost 2,000 calories per day. The forwards ate 735 grams of carbs per day, and the forwards 520 grams of carbs. Massive amounts of food and massive carb loads on a daily basis. Likely justified because of their level of exertion, and probably encouraged given the advantage of a larger BMI.
Let’s take a look at some more relatable examples:
1. Skeeter Kawoopton (not his real name) was a high school athlete. After college he met a girl, fell in love, and at age 32 insidiously developed a Dad bod. Sound familiar? And that Dad bod was associated with some alarming metabolic lab abnormalities. Triglyceride (Tg) is fat in the blood and is generally a reflection of carb consumption. Recall that we do not store carbs very well, but are outstanding in our ability to convert carb to fat for subsequent storage. Skeeter’s Tg was 407. This is extremely abnormal, with optimal levels being <100. Very commonly I see low carb, high fat eaters with Tg <50. Because we are outstanding fat storers, the liver will neglect other functions in order to produce fat. The production of good cholesterol, HDL, is one of those neglected functions. Skeeter’s HDL was 27. Less than 40 is an independent risk factor for heart disease! His Tg/HDL ratio was thus 15. Folks, this is unbelievably bad. I don’t even like a ratio of 3. And his liver was sick, with ALT of 70 and AST of 54. We had a calm, nurturing, and informative discussion. There was no desk pounding or screaming about dying young, about having the worst lab I’d seen in recent memory, nor did I imply he was a candidate for 14 different medications. He did not return for three years. I’m sure he was super busy or something. Well, the scream-, er, nurturing worked. He had changed his diet dramatically and learned to mindfully enjoy much less carb. The only supplement he started was fish oil. Follow-up labs showed Tg of 110, HDL of 41, ALT of 33, and AST of 28. Tg/HDL ratio now 2.7, and liver tests completely normal. He also leaned out (was 216 pounds with BMI of 28.5, improved to 194.4 with BMI of 25.6) and had much more energy. Way to go Skeeter!
2. Pinecone Rodranish (not his real name) did shift work for the railroad. He ate whatever he could get, felt poorly, and reached the milestone BMI of obesity at 30.6. His ALT was 121 (ouch) and AST 61. Interestingly his cholesterol panel and Tg were quite good. Again, the caring nurturer in me took over and as far as you know nothing was actually broken when thrown in the examination room. Five months later, he reported the elimination of sugar-sweetened beverages, vastly less overall carb, and a focus on the logistics of taking food with him when at work. He lost 24 pounds without exercise, and cured his obesity achieving a BMI of 27. ALT and AST normalized to 39 and 36. And he felt much enhanced energy and sense of well-being. Great work Pinecone!
Summary
Experimentally proven, and clinically observed (thousands of times) the fructose in sugar and high-fructose corn syrup has a major role in the formation of all NAFLD variants. The primary inciting mechanisms stimulated by fructose and its partner in crime uric acid involve the direct stimulation of fat formation (lipogenesis) and the inhibition of fat burning.
Numerous other modulating mechanisms exist as well involving the blood sugar driven fructose formation, gut transport of fructose, leaky gut, immune system activation and inflammation.
High, total carbohydrate consumption is also more than capable of causing NAFLD. Authors of the rugby study state, “diet is more influential than exercise in the onset of NAFLD among rugby football players.” I would add that diet is more influential than exercise in ALL metabolic diseases.
Again, relative caloric restriction, intermittent fasting, low carb/high fat/mindful eating is the most potent thing you can do to stack the deck in your favor of avoiding disease and enjoying functional longevity. Athletes…reserve the bulk of your carb for longer training and competition, and do NOT fuel with simple sugar. Excessive liver fat is just one of the many faces of metabolic disease. Obesity, diabetes, hypertension, and cancer might seem like vastly different entities but commonly have the same distorted metabolic drivers–Excessive Sugar Consumption.
Regardless of your athletic proclivities, now is the time to understand optimal human animal eating, and to employ it in an enjoyable and sustainable way. Don’t expect your doctor, nutritionist, spouse, or government to provide you with sound advice. Most of them are dinosaurs. Curate for yourselves.